 AppVerz
Blog / 6 November 2026
Why is my fan on? Finding the answer in Stackyard's Vitals
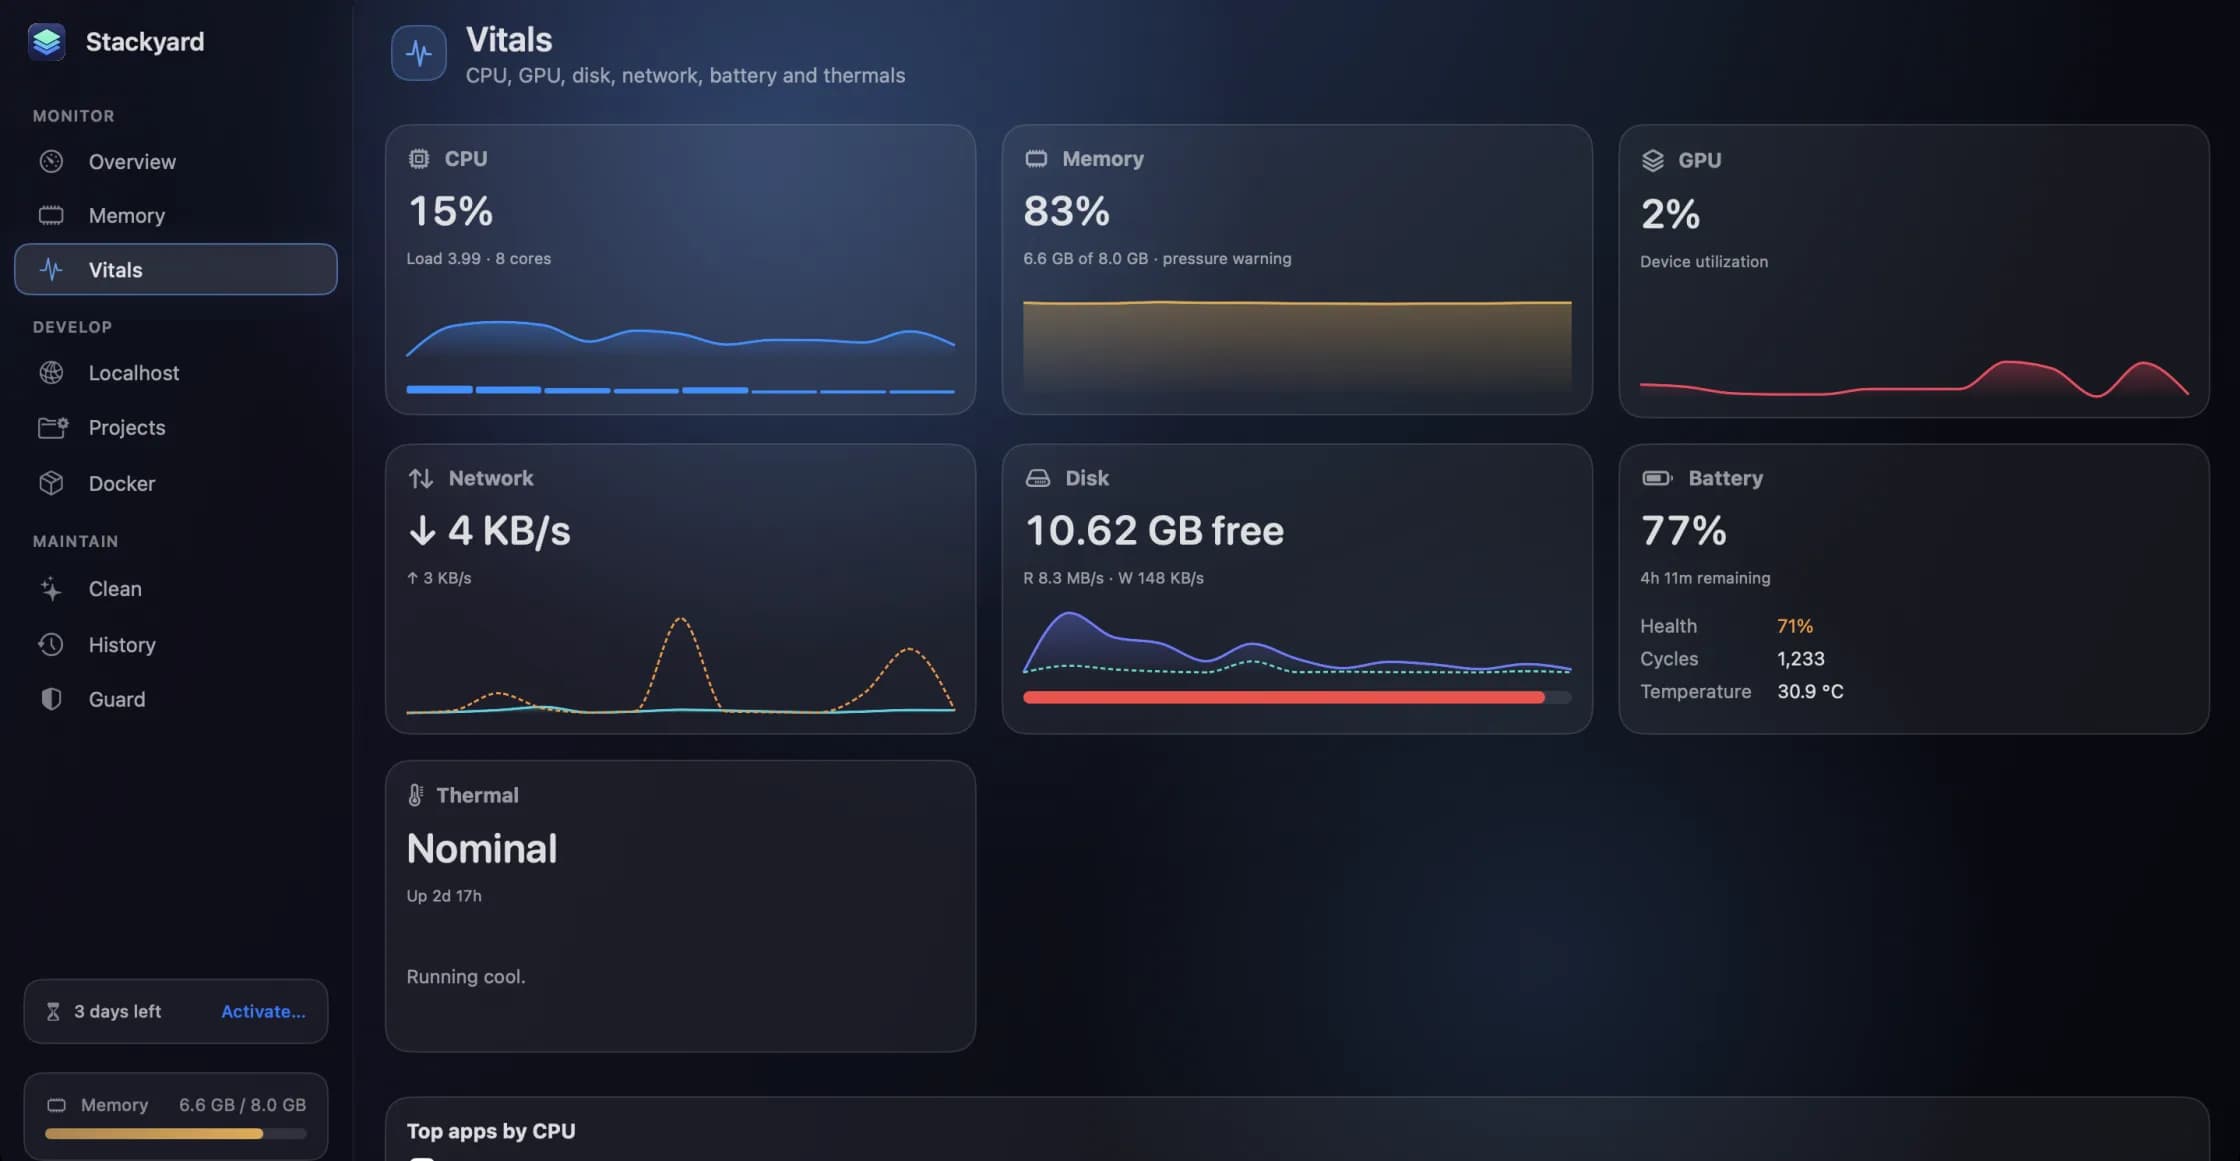
A Mac's fan turns on for a reason, and the reason is nearly always one app. Stackyard's Vitals shows CPU per core, GPU, network, disk, battery and thermal state live, ranks apps by energy, and shows which apps are using your connection right now.
The fan turning on is a Mac telling you something is working hard. Usually that is fine: you are exporting a video, compiling a large project, or running a container that does a lot. But sometimes the fan comes on while you are reading email, and that means something is busy that you did not ask to be.
Activity Monitor can find it, if you know which tab to look at and how to read it. Stackyard puts the answer in one section, Vitals (⌘3), and this post goes through how to read it.
The cards
Vitals is a grid of live cards, one for each part of the machine:
- CPU, in total and per core. One core pinned at 100 percent while the rest idle is the signature of a single stuck process. All cores busy is real work, like a build.
- GPU utilisation. Worth checking when a browser tab with heavy animation, a game engine or a machine-learning job is running.
- Network, upload and download speed. A large unexplained upload is worth knowing about.
- Disk, activity and free space. Heavy disk activity on a nearly full disk often means the system is swapping.
- Battery, with health, cycle count and temperature, on a laptop.
- Thermal state, macOS's own verdict on how hot the Mac is running.
The thermal state is the one to watch when the fan is on. Nominal means the Mac is comfortable, whatever the fan is doing. When it climbs, macOS may start slowing the processor down to cool off, which is when the heat turns into sluggishness.
Top energy: the card that answers the question
Below the vitals, two lists rank your apps. Top apps sorts by CPU and shows each one's energy impact. Top energy sorts by energy, and it is the card that most directly answers "why is my fan on?", because energy use is what produces heat.
In our experience, the app at the top of that list when the fan comes on unexpectedly is usually one of a few kinds:
- A browser with a busy tab: a video, a page with heavy animation, or a web app that keeps working in the background.
- Docker's virtual machine, which can keep using the processor even when your containers look idle.
- A dev server with a file watcher watching a large folder, especially one that was left running after its terminal closed.
- A first sync or an index, after you unpack a large archive or sign in to a cloud drive. These finish on their own.
Network by app
The third list shows which apps are using your connection right now. It is useful when the network card shows an upload you did not expect, or when a video call stutters and you want to know what else is competing for bandwidth.
To keep Stackyard itself light, this card only runs while it is on screen. Move away from Vitals and it stops measuring.
From Vitals to a fix
Vitals tells you what is busy. Fixing it is usually one step from there:
- If it is an app you do not need right now, quit it from the Memory section (⌘2), where each row has Quit and Force Quit, or press ⌘K and type its name.
- If it is Docker, stop the containers you are not using in the Docker section (⌘6), or stop a whole Compose project at once.
- If it is a
nodeorpythonprocess with no terminal attached, it is an orphan. The orphans post explains how Stackyard finds them and tells you which tool left each one.
Keeping an eye on it without opening the window
You do not have to keep Vitals open to know when something is wrong. Stackyard's menu-bar item shows memory in use and adds ⚠︎ when pressure is high, and its menu lists the heaviest apps with a Quit button each. The Overview (⌘1) has small CPU, GPU, network and disk charts and the top energy users on one screen.
For a problem that builds up slowly rather than all at once, Guard can notify you when memory pressure stays high, and flag an app whose memory keeps growing. That is covered in the post on Guard, History and Meeting Mode.
Stackyard is a free preview for Mac developers. Ask for a build on its page, and the user guide covers every section.
Questions people ask
- Does the network-by-app card slow my Mac down?
- It only runs while the card is on screen. Leave Vitals, or scroll the card out of view, and it stops.
- What does the thermal state mean?
- It is macOS's own summary of how hot the Mac is running. Nominal means there is nothing to worry about. Higher states mean the system may be slowing itself down to cool off.
- Can Stackyard control the fan?
- No. Stackyard shows what is making the Mac work hard and lets you quit it. It does not change fan speeds or any hardware settings.
Related reading
- Activity Monitor is free and already on your Mac. Here is what Stackyard addsActivity Monitor sees every process, and it is the right tool for a deep dive. What it does not do is think like a developer: group an app's helpers, tell you who left a node process running, put a health dot on a port, or start your project. An honest comparison.
- The node process your terminal left behind: memory and orphans in StackyardClose a terminal tab and the dev server inside it can keep running for days. How Stackyard groups memory the way you think about apps, finds the node and python processes nobody is watching, and tells you which tool left each one.
- Guard, History and Meeting Mode: the parts of Stackyard that work while you don'tA notification when memory pressure stays high, leak detection that ignores a single spike, orphans quit on a timer, apps quit when unused, and a Meeting Mode that frees memory for a call and puts everything back after. Plus a 24-hour memory history, widgets and stackyard:// links.
Have a question about any of this?
Write in. The person who built the apps reads every message and replies within two working days.