 AppVerz
Blog / 4 November 2026
Looking back: the timeline, the heatmap and reports you can take out of FocusLens
A per-session log for any day, one app at a time with its busiest day and typical session, a week drawn hour by hour, and weekly or monthly reports you can export as PDF or CSV. The four ways FocusLens lets you look back, and what each one is for.
The Today screen is for the day you are in. Most of what FocusLens is good for, though, comes from looking back: at yesterday, at last week, at the pattern across a month you could not see while you were living it. FocusLens has four places for that, and they answer different questions.
The Timeline: what happened, in order
The Timeline is the raw record. Pick any day and it lists every session in order: the app, a category badge, the start and end times and the duration. Beside the list sit the day's totals and its category split.
It is the view to use when a number elsewhere surprises you. If yesterday's focus score was lower than it felt, the Timeline shows you why, session by session: the morning that turned out to be forty minutes of real work between short visits to mail, or the afternoon block badged as neutral because your writing tool was misfiled.
Two filters keep it readable. Anything under five seconds is never recorded at all, because flicking through three apps to find a window is noise, not activity. And the Timeline hides sessions under ten seconds. If you want a different floor, Settings has a minimum session length slider.
Applications: one app at a time
The Applications view turns the same data around. On the left, every app FocusLens has tracked, with its category and session count. Select one and the right side fills in with that app's story: total time, number of sessions, average and longest session, a daily usage chart, its busiest day, and a session-length distribution.
The distribution is the underrated part. Two apps with the same total time can have completely different shapes. An editor where most sessions run forty-five minutes is a tool you work in. A chat app with three hundred sessions averaging forty seconds is a tool that interrupts you. The totals hide that; the distribution shows it.
Analytics: the shape of a week
Analytics is the pattern view. Its centrepiece is a heatmap of the last seven days by hour, which shows at a glance when in the day you actually do focused work. Beside it, a donut chart splits your time by category, and an hourly productivity chart calls out your peak focus window.
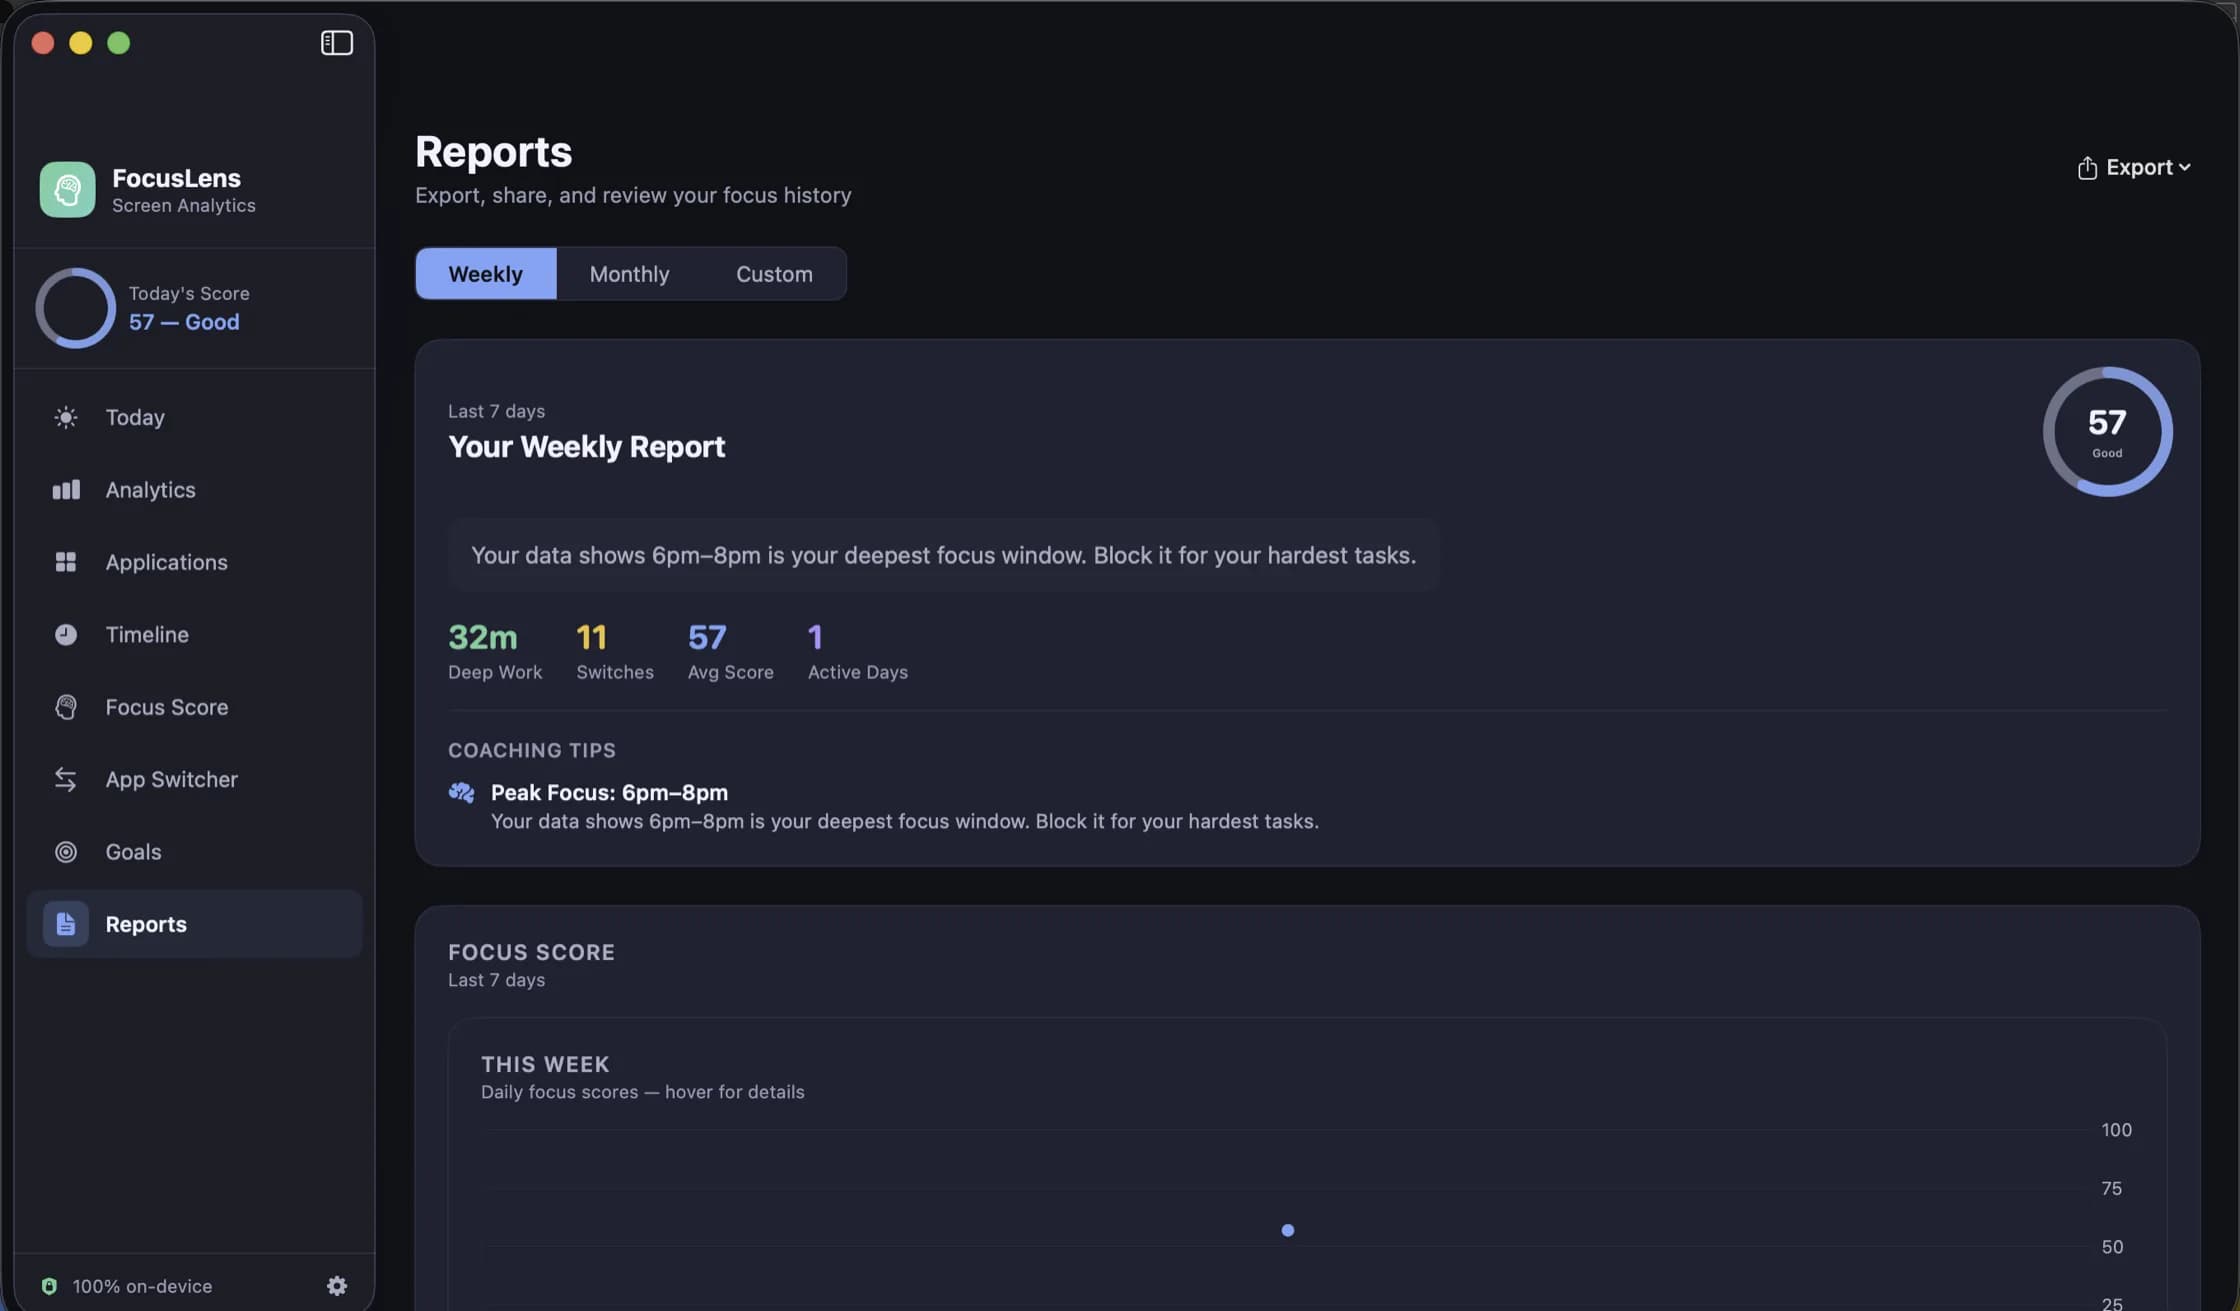
That window is the single most actionable thing FocusLens tells most people. The screenshot on the FocusLens page shows a peak between six and eight in the evening, with 87 percent of tracked time productive. Whatever your window is, it is the stretch of the day most worth protecting from meetings and notifications, and the Today screen's coaching insight names it so you see it daily rather than only when you open Analytics.
Every chart answers on hover, so the exact figure for a particular hour is always one pointer movement away.
Reports: a written summary you can send
Reports is the view built for leaving the app. Choose a weekly or monthly report, or a custom date range, and FocusLens writes it up: a summary in sentences, an average score ring, deep work, switches, average score and active days, coaching tips, and the score history for the period. It also compares the first half of the range with the second, so you can see whether a change you made mid-month actually moved anything.
Then export it:
- PDF, to send to a manager, a coach, or your own archive.
- CSV, to take somewhere that does its own arithmetic: a spreadsheet, a notebook, a script.
CSV is also the best way to report a problem with the numbers. If a figure for a particular app on a particular day looks wrong, exporting that day makes the issue obvious to us and to you.
Keeping it, and clearing it
Everything these views draw on lives in FocusLens's own storage on your Mac, plus a container shared with the widget so it can show today's summary without the app running. FocusLens makes no network requests at all, so none of it is synced or backed up anywhere by us; it is covered by whatever backup and encryption you already use for your Mac.
When you want it gone, Settings has a Clear Data button that empties everything the app has recorded, after asking. Deleting the app removes the rest.
A weekly habit that takes five minutes
- On Friday, open Reports and read the weekly summary.
- Look at the first-half against second-half comparison. Did anything change?
- Open Analytics and check that your peak window has not moved.
- Pick one app from the App Switcher's worst offenders and look it up in Applications. Is its session shape what you expected?
- Adjust one thing for next week, and if it is a number, make it a goal.
FocusLens is free and available as a preview by email while the release build is notarized.
Questions people ask
- Can I export my FocusLens data?
- Yes. Reports exports the range you are looking at as a PDF to send on, or as CSV for a spreadsheet. Nothing is locked in, and nothing has to go through us to get it out.
- Why are short switches missing from the timeline?
- On purpose. Anything under five seconds is never recorded, and the timeline hides sessions under ten. Settings has a minimum session length slider if you want a different floor.
- How do I delete everything FocusLens has recorded?
- Settings has a Clear Data button that empties it, after asking. Deleting the app removes the rest, including the shared container the widget reads.
Related reading
- Categories you can argue with: how FocusLens files your apps, and how to overrule itProductive, communication, distracting, entertainment, utilities, neutral. FocusLens sorts every app into one of six categories by default, and the default will be wrong about somebody's job. Here is what each category does to your numbers, and how one override rewrites your whole history.
- Goals that read from real usage: targets and limits in FocusLensA goal you type once and then track by memory is a wish. FocusLens fills every goal's progress bar from the hours you actually logged: a daily target for the work you want more of, a limit for the time you want less of.
- The FocusLens focus score, taken apart: four parts, four ceilingsOne number out of 100 is easy to read and easy to misread. FocusLens builds its focus score from deep work, context switching, low distraction and your longest streak, and shows each part on its own bar so a bad day tells you what went wrong.
Have a question about any of this?
Write in. The person who built the apps reads every message and replies within two working days.